Oops, I Used the Wrong Indicator
This demonstration shows four acid-base titrations using two different indicators. Two titrations are performed using 0.1 M HC2H3O2 and 0.1 M NaOH. The first titration uses methyl red that goes from pink to yellow near a pH of 5. The second titration uses phenolphthalein that changes from colorless to pink near a pH of 9. The demonstration can be viewed below:
Background
To effectively highlight the distinction between endpoint and equivalence point we must start with some background. Equivalence point is defined as the point in a titration where stoichiometrical equivalent moles of acid and bases have been added. For these reactions where acid and base react in a 1:1 fashion, this is where equal moles of acid and base have been added. At the equivalence point the products of the neutralization establish an equilibrium with the water present. If a strong acid and strong base are mixed, the products do not effect the equilibrium significantly and the solution will be neutral with a pH near seven. But when weak acids or weak bases are used, the conjugates of these will react with the water and establish an equilibrium with unequal amounts of acid and base. The pH of these mixtures will typically not be seven. If a weak acid is neutralized by a strong base, the conjugate base of the weak acid will react with water to increase the hydroxide concentration and lower the hydronium concentration.
An acid-base indicator is a weak acid/weak base that has different colors when it is in the acidic or basic form. An indicator is often represented by the formula HIn where HIn is the acidic form and In- is the conjugate base of the indicator. When the indicator is put into an acidic solution, it will be of the form HIn and in a basic solution it will be mostly in the In- form. The indicator has a pKa value that gives us guidance into when this color change will occur. When the pH is equal to the pKa of the indicator, both forms will be present and the color will be a mixture of the two. When pH is 1 unit lower than the pKa value, the acidic form will be present in a ratio of 10:1. When pH is 1 unit higher than the pKa value, the basic form will be present in a ratio of 10:1. So we expect the indicator to change color over a range of 2 pH units. In this experiment, methyl red (pKa = 5) is used which will change from pink to yellow over a pH range of 4-6. Phenolphthalein (pKa = 9) is the second indicator used which changes from colorless to pink over the pH range of 8-10. These color changes are called the endpoint of the titration. If you were without a pH sensor, you would rely on these to determine when equivalent amounts of acid and base are present.
Analysis

Figure 1: Titration of acetic acid with sodium hydroxide
In Figure 1, the methyl red is in the pink form as the pH is below the pKa. As the pink color fades and the yellow color increases we will reach our endpoint of the titration.
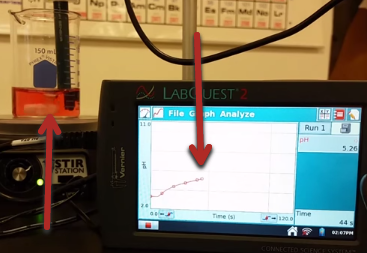
Figure 2: Titration of acetic acid with sodium hydroxide
In Figure 2, we now see the pink color changing to a mixture of yellow and pink. This is our endpoint of the titration. The arrow marks on the LabQuest 2 unit where this moment is. Note that this is not occuring during an inflection point where the slope rises rapidly. This endpoint is poor because it is not happening at the same time or near the same time as the equivalence point. If he had not had a pH sensor available we would have received an incorrect volume required to complete the reaction.

Figure 3: Titration of acetic acid with sodium hydroxide
In Figure 3 we continue to see the color change from pink to yellow. We have still not seen the inflection point indicating that the acid and base are present in equivalent amounts.
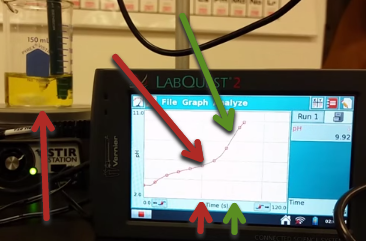
Figure 4: Titration of acetic acid with sodium hydroxide
In Figure 4 above we now finally can see where the equivalence point is. Note that the pH at equivalence is above 7, as we would expect for a weak acid being titrated with a strong base. At the point of neutralization the acetate ion establishes an equilibrium where hydroxide is present at larger concentration than hydronium. We can also now compare our equivalence point (green arrows) and endpoint (red arrows). It is difficult to pinpoint exactly where the endpoint is because the color change is not sharp as the color change occurs during a buffering region. We have given a rather generous endpoint that the reader can choose to examine with a more critical eye if desired. Many will note that the two are not at the same point on the curve and that this is going to cause error. To determine how much error, we must then determine the volume of base added at the time of the endpoint where the color change occurred and the volume of base added at the time of equivalence. The smaller arrows at the bottom of the display can be used for this. The small red arrow in Figure 4 should be compared to the small green arrow in Figure 4. The gap between these should then be compared to the total time of the titration to that point to determine the approximate error assuming time can be correlated with volume of base added. In these figures a buret is constantly emptying into the flask, so as time progresses the volume of base added is increasing. It is the volume that we use to find out answer. We are typically doing a titration to use a known concentration to react with an unknown concentration so that we can determine the unknown concentration. This is done using the volume and concentration of the known to calculate the unknown concentration. In the above example, using the wrong indicator appears to be giving us about 20% error in volume before any other errors are considered. This is why choosing an appropriate indicator is critical for a titration.
Now we shall run through the same titration done with phenolphthalein. Phenolphthalein is colorless in the protonated form and pink in the deprotonated form. The transition from colorless to pink occurs in the pH range of 8-10.
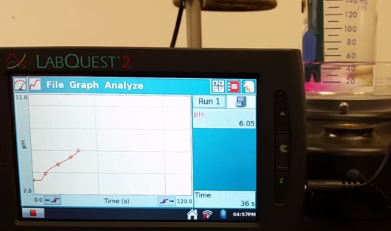
Figure 5: Titration of acetic acid with sodium hydroxide
In Figure 5 above the solution is colorless. The splash of pink is from the base not being evenly distributed as anyone who has run a titration before is familiar with. This buret emptied faster than the previous one, but this point for the previous one would have been near the endpoint.
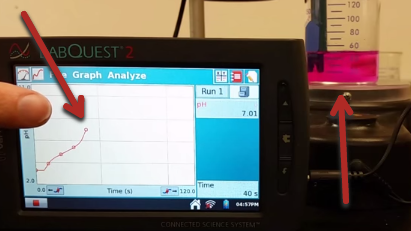
Figure 6: Titration of acetic acid with sodium hydroxide
In Figure 6 we are now at the endpoint of the titration. The pH is rising rapidly as well which would indicate that we are probably near the equivalence point as well.
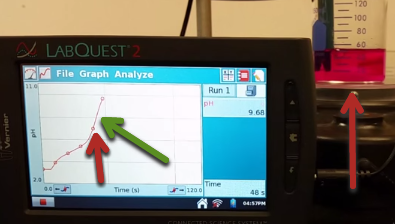
Figure 7: Titration of acetic acid with sodium hydroxide
In Figure 7 our titration is now complete and excess base is in the system. The pink color is not vibrant and we have surpassed the equivalence point. The green arrow is meant to indicate the location of the equivalence point and the red arrow the endpoint. However, both of those are difficult to differentiate because of the rapid flow of sodium hydroxide into the beaker. They may be even closer than indicated above. Nonetheless the error from endpoint and equivalence point is nearly erase. The pH of a 0.05 M solution of sodium acetate (what is present at equivalence) projects to be a pH of 8.7 and the half-equivalence point should have a pH of 4.7
No comments:
Post a Comment