Enthalpy H
What Enthalpy is:
Enthalpy is defined by the function dH = dU + PdV where dU = dQ + dW.
(H - enthalpy, U - internal energy, P - pressure, V - volume, Q - heat, W - work)
What the purpose of enthalpy is:
Enthalpy takes advantage of the 1st law of thermodynamics to simplify energy exchanges between a system and surroundings. Because we can often control the surroundings to transfer all energy as heat (such as by using a calorimeter), we can equate the energy gained or lost by the surroundings to the enthalpy gained or lost by the system (ΔHsys = Qsurr). When energy transfer occurs during a chemical or physical process, the system will often undergo multiple transformations. This complexity is simplified by using enthalpy which includes expansion/contraction as well as thermal energy gains.
It is very difficult to assign a single energy value to a system. It is much easier to describe the system by its changes in energy. Enthalpy is a mathematical tool to simplify this analysis down into a single step instead of having to concern kinetic (thermal) and potential (phase/expansion/contraction) energy considerations.
What the sign of ΔH means:
When ΔH is +, this means that the system is gaining energy from the surroundings. This is referred to as endothermic, but only for the system. When ΔH is -, this means that the system is losing energy to the surroundings. For both of these it is important to note that the total energy change is 0 per the 1st law of thermodynamics. So when a system has ΔH as a - value, this means that the change was exothermic with respect to the system and endothermic with respect to the surroundings. All changes that involve energy exchange have an endothermic and exothermic component, it depends on what the system is defined as. For example, students are often confused by the fact that ice melting is endothermic while a chemical reaction in solution that heats up is exothermic. To a student, both of these show signs of increase in energy yet meltings is assigned endothermic status and the reaction is exothermic. The reason for this discrepancy is that ice is considered to be the system but the water is considered to be the surroundings to the chemical mixture. When a system is not defined in the problem, it is nearly always assumed to be the chemical mixture involved in the physical or chemical change occurring.
How to calculate ΔH:
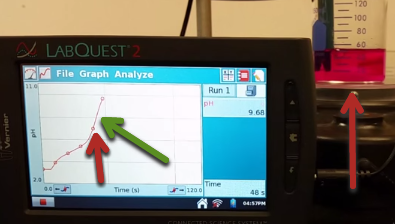
There are four typical methods of calculating ΔH. The first is called calorimetry and involves a chemical or physical change happening in a calorimeter.
1. Calorimetry
The heat gained or lost by the calorimeter is equivalent to the enthalpy change of the process being analyzed per unit mole of the reaction. To calculate this we use ΔH = Q/mol or ΔHrxn = Qcal/molrxn. The Q is calculated using Q = mCΔT or Q = H.C.ΔT or both where C is the specific heat capacity and H.C. is the heat capacity. In a coffee cup calorimeter, the heat going into the cup itself is calculated using Qcup = H.C.cup*ΔT and the heat going into the water in the coffee cup is calculated using QH2O = mCΔT. The total heat is the sum of those two values. This can be divided by the number of moles of chemical used to find the enthalpy change of the process.
2. Hess’s Law
Hess’s Law is used when you are not able to determine the enthalpy of a reaction, but do know several other reactions that can be combined into the one you do not know. The sum of the enthalpies for the known reaction will add up to that of the unknown reaction as long as the known reactions will sum to the exact unknown reaction. For example, converting diamond into graphite is extremely difficult to carry out and would be very expensive and difficult to accurately measure the enthalpy change of.
C(diamond) → C(graphite) ΔHrxn = ???
But burning diamond and burning graphite is much easier to accomplish and measure.
a. C(diamond) + O2(g) → CO2(g) ΔHrxn = -395.4 kJ/mol
b. C(graphite) + O2(g) → CO2(g) ΔHrxn = -393.5 kJ/mol
We can produce the unknown reaction by adding reaction a to the reverse of reaction b. The CO2 and O2 will be present as reactants and products and thus cancel when the two reactions are added. By reversing equation b, we do change the sign from - to +.
- C(diamond) + O2(g) → CO2(g) ΔHrxn = -395.4 kJ/mol
+ b. CO2(g) → C(graphite) + O2(g) + ΔHrxn = +393.5 kJ/mol
unk. C(diamond) → C(graphite) ΔHrxn = -1.9 kJ/mol
3. Standard enthalpy of formation ΔHf°
A standard enthalpy of formation value is the enthalpy change that accompanies the formation of an element or compound from its elements under standard conditions. These can be determined experimentally using calorimetry and this has been done for many compounds and can be found in appendices of textbooks. The standard enthalpy of formation for CH4(g) is the enthalpy change that accompanies the following transformation:
C(s, graphite) + 2H2(g) → CH4(g) ΔHf°=-74.9 kJ/mol
The standard enthalpy of formation for any element is 0 as long as the element is in its standard state under normal conditions. For example, bromine is typically Br2 and liquid under standard conditions. The enthalpy of formation of liquid bromine is 0 but gaseous bromine is not.
To calculate the ΔHrxn using ΔHf° values you would add the total of all of the products ΔHf° values, add the total of all of the reactant ΔHf° values and subtract products - reactants.
Σproducts ΔHf° - Σreactants ΔHf° = ΔH°rxn
4. Bond enthalpies
Bond enthalpies or bond energies are defined as the energy required to break 1 mol of a particular bond. These have to be averaged over multiple molecules because the exact bond energy varies depending on the polarization caused by neighboring atoms. These values can also be found in most appendices of chemistry textbooks.
To calculate ΔH°rxn using bond enthalpies just add up all of the bond enthalpies for every bond broken and every bond formed. Bond breaking is endothermic and so these values are positive. Bond forming is exothermic so these values are negative. If the bonds broken are stronger (larger energy) than the bonds formed, the overall reaction is endothermic. If the bonds formed are stronger than the bonds broken, the overall reaction is exothermic.
Entropy S
What Entropy is:
Entropy is defined by the functions dS = dQ/T and S = k ln W. W is a quantitative description of how many microstates there are and k is the Boltzmann constant.
What the purpose of entropy is:
It is important to show the definition of entropy, either from the historical definition proposed by Rudolph Clausius and applied be Willard Gibbs, or through the statistical analysis of Ludwig Boltzmann. It should be stressed that an understanding of what entropy is lies beyond that of a high school student. You can state that entropy correlates with disorder, but it should not be defined as this and if it is, it should be articulated clearly that this is a placeholder until higher levels of math, statistics and physics are available.
The purpose of entropy is that the rules of physics make it so that entropy can be used to make predictions and also explain whether or not something will happen based upon all energy considerations. A precise definition of entropy is not needed in order to use entropy to predict whether or not a process will occur without work being applied.
What the sign of ΔS means:
If ΔS = +, this means that entropy has increased and this can be stated as the energy in a system has increased its dispersal. This generally happens via two pathways. Either more energy was added to the system or the system has expanded in volume so that the energy in that system has a wider distribution in space. ΔS being + is associated with the following (with a few exceptions):
- increasing temperature
- Changing from solid to liquid, liquid to gas or solid to gas (melting, boiling, sublimating, vaporizing)
- dissolving
- expansion of a gas
- chemical reactions where the # of gas molecules increases
ΔS being - is associated with the following (with a few exceptions):
- decreasing temperature
- Changing from gas to liquid, liquid to solid, gas to solid (condensing, freezing, deposition)
- crystallization
- contraction of a gas
- chemical reactions where the # of gas molecules decreases
Chemicals also have entropy values calculated for them. In order to do this, it is assumed that the entropy of the chemical is 0 at absolute zero (0 K) and the specific heat capacity of the substance is used to determine the entropy under different conditions. Larger molecules and gases tend to have higher entropies.
How to calculate ΔS:
Standard entropy values have previously been determined and can be found in the appendices of textbooks. This will be the only method used to calculate entropy and often we will use signs to make a qualitative assignment of entropy changes.
Σproducts ΔS° - Σreactants ΔS° = ΔS°rxn
Gibbs Free Energy G
What Gibbs free energy is:
dG = dU + PdV - TdS or ΔG = ΔH - TΔS
When Clausius introduced the entropy term, many did not understand what it was. It was Gibbs that developed the physical interpretations of this term and combined it into the first equation shown above. Later Walther Nernst combined the internal energy and pressure-volume work functions into a single enthalpy term which gives us the equation most common to introductory chemistry today.
What the purpose of Gibbs free energy is:
The purpose of Gibbs free energy depends on whether you are talking about ΔG or ΔG°. ΔG° is used to compare the energy stability of a chemical reaction mixture at standard conditions. This can be used to make determinations about a reaction or physical change but is limited to standard conditions and while at equilibrium. ΔG° can tell you information about the equilibrium constant of the reaction and the electromotive force (EMF) for a redox reaction. ΔG on the other hand is not limited to being at equilibrium. ΔG gives you information about a specific mixture of chemicals and how they will change based on their amounts as well as all of the other information about them. ΔG° will tell you how the amounts of products and reactants compare at equilibrium and ΔG will tell you how a specific mixture under specific conditions will proceed to achieve equilibrium.
ΔG° can be related to the equilibrium constant using ΔG° = -RT ln K. ΔG° can be related to E°cell by the equation ΔG° = -nFE°cell. ΔG can be used with the equation ΔG = ΔG°+RT ln Q. This allows us to use the energy comparisons of products/reactants (ΔG°) along with the reaction conditions (RT ln Q) to determine the maximum amount of work (free energy) capable of being produced as the reaction proceeds to equilibrium.
What the sign of ΔG means:
If ΔG° = -, the reaction under standard conditions is spontaneous and will achieve an equilibrium where K is greater than 1. The voltage under standard conditions (including activities) will be positive.
If ΔG° = +, the reaction under standard conditions is not spontaneous and will achieve an equilibrium where K is smaller than 1. The voltage under standard conditions (including activities) is negative.
If ΔG = -, the particular reaction mixture will form more products to achieve equilibrium. This will occur spontaneously.
If ΔG = +, the particular reaction mixture will form more reactants to achieve equilibrium. In order to form more products, work must be done on the system.
If ΔG° = 0, the reaction under standard conditions will have an equilibrium constant of 1. The voltage under standard conditions is 0. If ΔG = 0, the system is at equilibrium and ΔG° can be used to determine what the composition of the reaction mixture is.
How to calculate ΔG:
Calculate ΔG° with the equation ΔG° = ΔH° - TΔS°. Calculate ΔG with the equation ΔG = ΔH - TΔS. It is important to note that the units of ΔG and ΔH are often presented in kJ/mol while ΔS are in units of J/(mol*K). A conversion is usually needed. ΔGf° values can also be used in the same manner as ΔHf° using the equation:
Σproducts ΔGf° - Σreactants ΔGf° = ΔG°rxn
The equation ΔG = ΔG° + RT ln Q can be expanded to include redox chemistry calculations as well. Because ΔG = ΔG° + RT ln Q and ΔG° = -nFE°cell, we can combine these two equations to solve for the voltage supplied by a reaction not under standard conditions to be
Ecell = E°cell - (RT/nF) ln Q or Ecell = E°cell - (0.0257/n) ln Q or Ecell = E°cell - (0.0591/n) log Q. These equations are referred to as the Nernst equation and allow us to simplify a very complicated analysis of ions and electrons into a much easier calculation.
Calculations with ΔG are often done qualitatively using only the signs of ΔS and ΔH. Because a negative value of ΔG is often desirable, we can see that an exothermic reaction (ΔH = -) will cause ΔG to decrease. ΔS on the other hand will cause ΔG to decrease when it is positive because it is subtracted and temperature in Kelvins is always positive.
ΔH
|
ΔS
|
ΔG
|
spontaneous?
|
-
|
+
|
-
|
always
|
+
|
-
|
+
|
never
|
-
|
-
|
depends on temperature
|
when |ΔH| > |TΔS|
|
+
|
+
|
depends on temperature
|
When |TΔS |> |ΔH|
|
Final Note
The definitions of enthalpy, entropy and Gibb’s free energy are highly technical and not of significant value for a student beginning in chemistry. Their purposes as predictive tools are much more relevant and these should be the focus for new students. Many educators struggle to define these terms adequately or consistently but still strive for this to be a focus. Momentum does not have good definition because it is a mathematical construct that is useful for making predictions about collisions. Knowing the equation in physical terms is meaningless in nearly all introductory situations in physics. But knowing that you can use this “momentum” tool to determine motion before or after a collision is a powerful tool and this should be the focus. The predictive measures of ΔH, ΔS and ΔG should be the focus of introductory physical chemistry. A wonderful summary of the history of these developments can be found in the thermodynamics section of Great Physicists by William H. Cropper.