Quantitative Analysis Experiment
A copper (II) sulfate of unknown concentration is prepared for each lab group. The solutions are then distributed where each group gets slightly more than 50 mL of solution to analyze and determine the concentration of in two manners.

Figure 1: 0.50 M solution of CuSO4 (middle) with two solutions with unknown concentration
Day 1:
After students receive their samples they should separate a large portion of their solution to mix with 0.2 M barium nitrate solution. This forms the barium sulfate precipitate that can be separated via filtration as shown below.
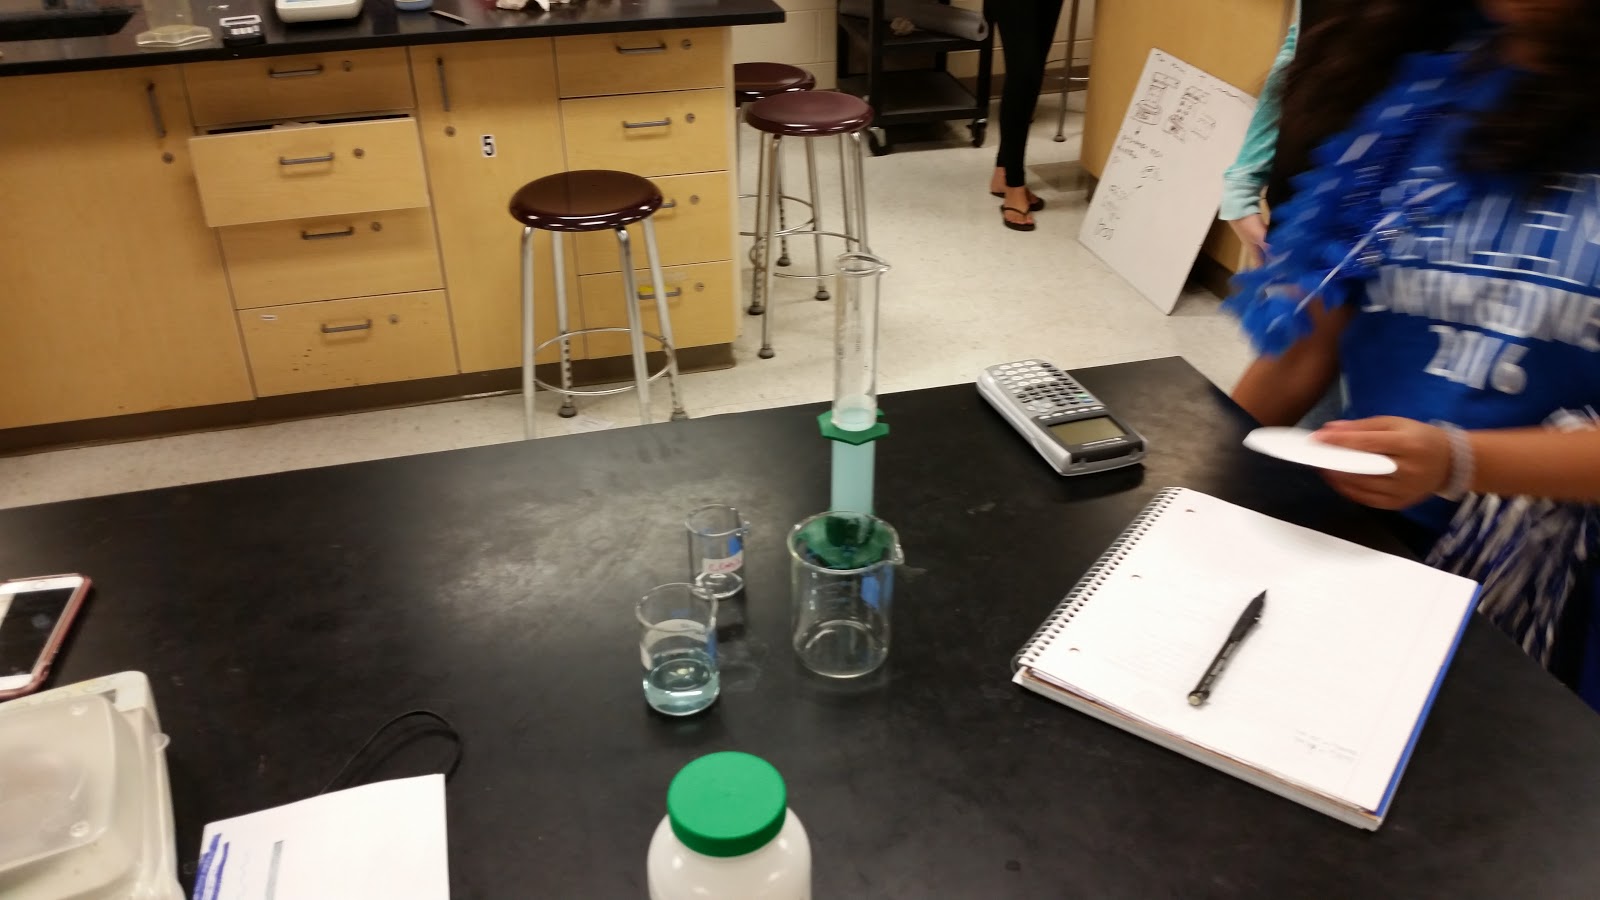
Figure 2: The graduated cylinder contains the unknown solution after mixing with barium nitrate

Figure 3: The mixture is now ready to filter, wash and dry
Day 2:
Today the students prepare a set of solutions with varying concentration to construct a calibration curve. The students have 0.50 M CuSO4 solution and distilled water. It is up to them to determine what an acceptable range of concentration is given the parameters that the highest and lowest possible concentrations are 0.08 M to 0.001 M for the unknown solutions. Today the students are also instructed on how to use the Vernier spectrophotometers to produce a line of best fit from their calibration curve. They are taught how to calibrate the spectrophotometer with distilled water, how to handle the cuvettes, how to select the appropriate wavelength of light for analysis, how to construct the calibration curve and finally how to produce a line of best fit for their data. Students may obtain the mass of their precipitate from day 1 at this point. Any errors in washing should be fixed today.
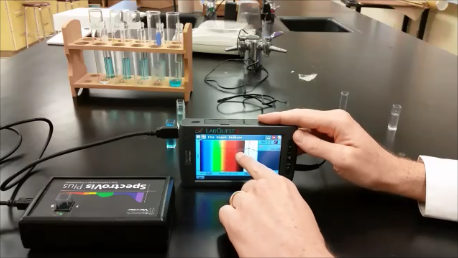
Figure 4: The spectrophotometer can be used to determine the appropriate wavelength for analysis, in this experiment red light near 700 nm is a good choice
Day 3
Students continue making solutions, testing the solutions with the spectrophotometers and begin calculations for their experiments. Students may re-mass their precipitates from day 1 again to confirm no water was present on day 2. Calculations should show how the concentration in molarity was determined in both experiments and should comment on the answers produced by both methods and what errors occur in each that make one method superior to the other. Video of the experiment