Activity 1 - What does hot mean? What does cold mean?
Have two identical beakers with identical amounts of water at identical temperatures. Have a temperature sensor in both. To the first beaker add a small amount of boiling water near 100 degrees. To the second beaker add a moderate amount of warm water near 60 degrees. Ask the students which beaker is hotter. Ask the students what does hotter mean? If the students stick to the first water sample as being hotter, point out that the other caused a greater increase in temperature of the water. If they choose the second sample of water, point out that the first started at a higher temperature. The Eureka video is a good ending to this discussion.
Activity 2 - Heating curve of ice water
Using Vernier Labquest 2, instruct students to heat ice water and make a plot of the temperature of the water vs. time until the water has been boiling for several minutes. Decide ahead of time if you want students to produce variety in their plots by instructing students to use a consistent amount or consistent heat setting for the hot plate.
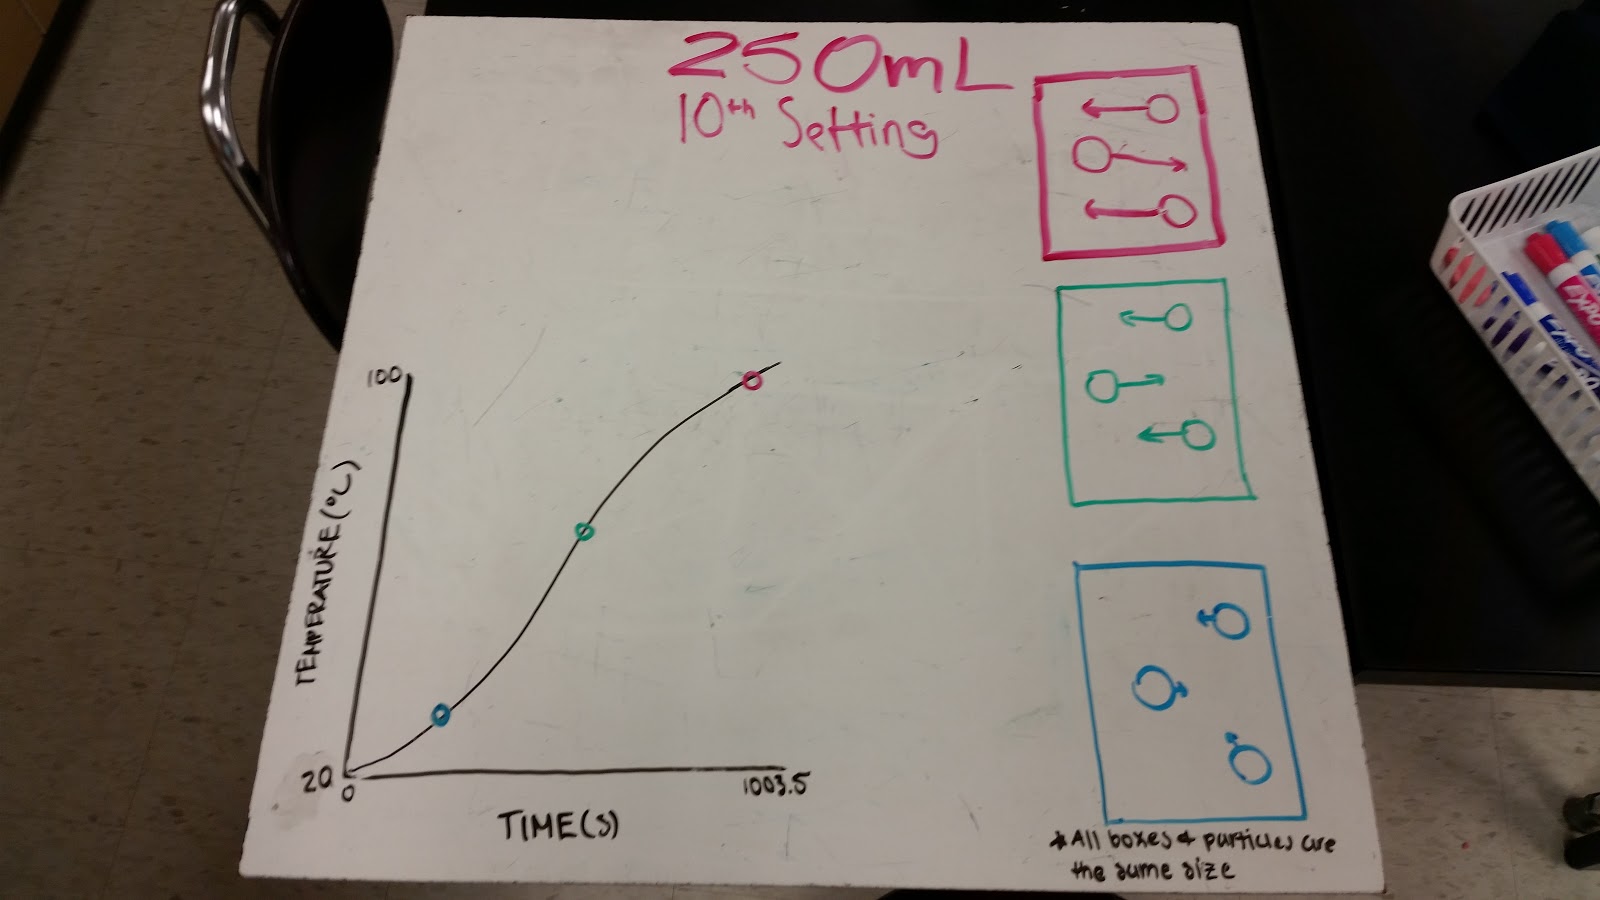
Figure 1: Whiteboard from activity 2
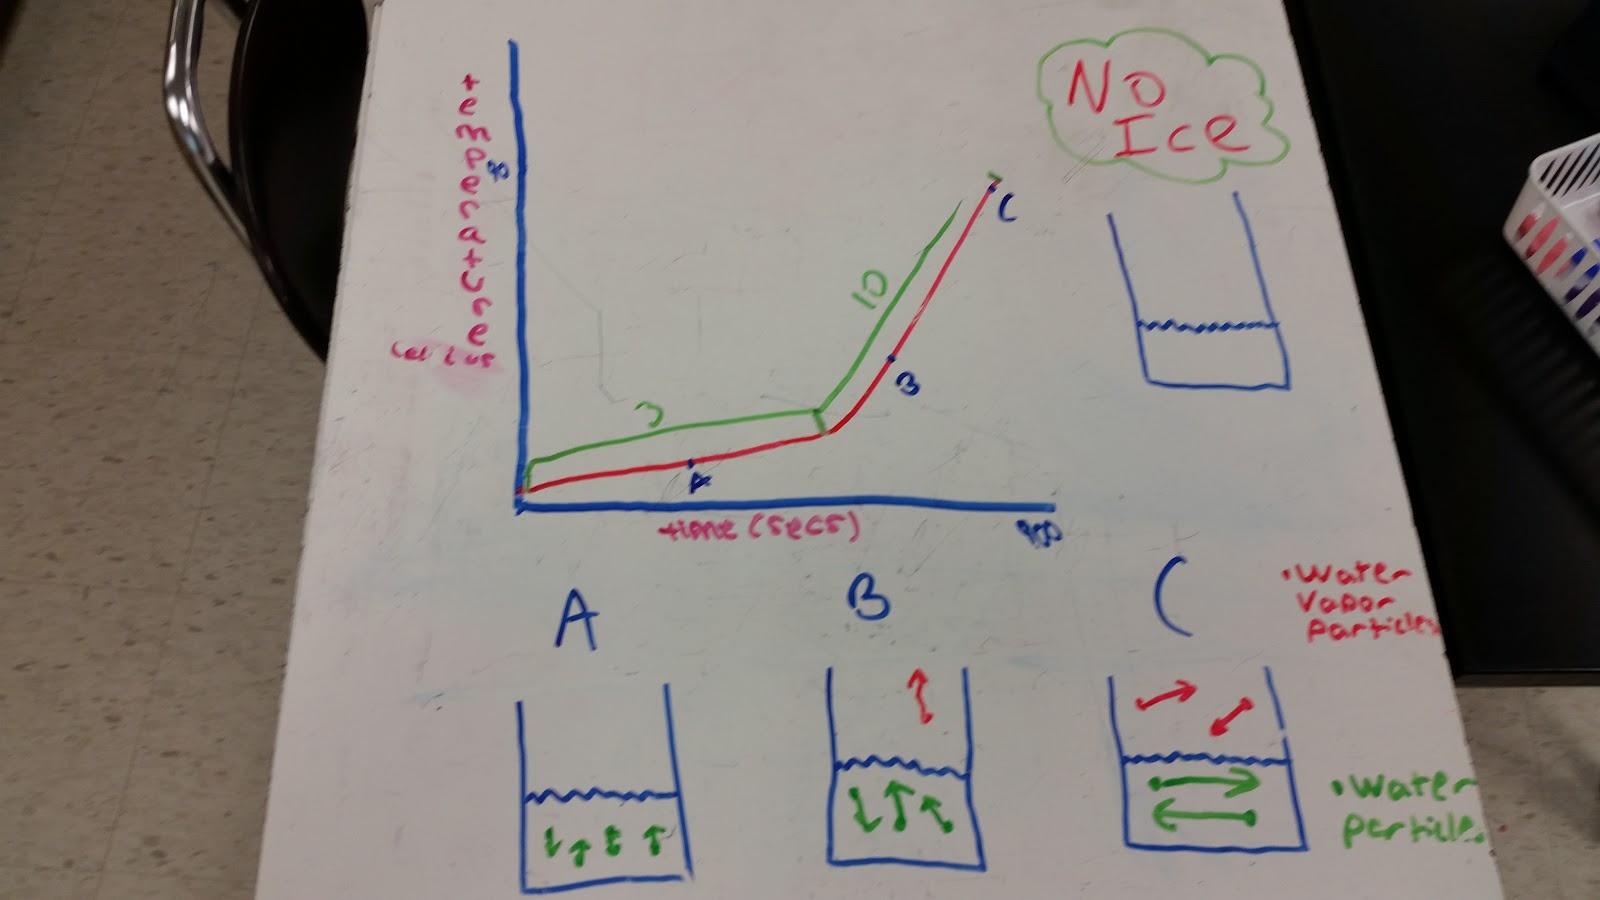
Figure 2: Whiteboard from activity 2 where the group adjusted the setting of the hot plate in the middle of the experiment
Discussion of whiteboards
The biggest key to discuss on the heating curves produced is why the temperature does not change while the water is boiling. It is important to frame the discrepancy well. You are heating the water and somehow the water particles are not changing speed. If your students produce melting that is also constant temperature this discussion will be even better because no particles (or negligible amounts of particles) are leaving the system. We are looking at a physics concept here, so be very cautious with language used and give lots of time for students to think. The hot plate particles are colliding with the particles in the beaker/water causing them to speed up. Yet when the water begins boiling, the water particles no longer speed up. How is it possible to push on something without the speed changing. In physics we would explain this by stating that when a net force is applied, the particles will accelerate and the temperature would rise. If the temperature is not changing, that means that another force must be restricting the motion of the particles. I can lift an object at a constant rate if a second force acts against my own force applied. In this instance the energy being added is not of motion (thermal energy) rather it is of position (potential energy). The landing point for this discussion is to get the students to understand this difference that when energy is added to a system of particles the energy can cause an increase in motion or positioning. Both occur at the same time during temperature changes as the particle spacing increases slightly while the thermal energy increases.
This landing point is not simple to get to, it also opens up some challenging ideas. Really a large number of collisions are happening and there is always a range of things happening within a system being heated. It is advised at this point to keep the discussion narrow near the end of the discussion and focus on small systems of particles. It also is dangerous to only use energy as an explanation. Use motion, force, collisions, spacing throughout the conversation. A key idea that helps drive the conversation forward is to work out how the hot plate works. The particles in the hot plate begin to move faster somehow via electricity. From there they collide with the particles in the beaker causing them to move faster. I like to use the phrase, the particles in the hot plate push on the particles in the beaker and water.
Some good questions to discuss or reflect on after a discussion include:
- What is happening on a particle level during melting or boiling?
- How can you push on something without it changing speed?
- How could we alter the slope of the heating curve during the portion where temperature changes?
- What is a for every statement for the slope of the heating curve and what is the physical interpretation of it?
- If the plateau during melting is not as long as the plateau during boiling, what does that mean?
Activity #3 - LOL diagram notes
Now is the time to introduce Energy Bar Charts or LOL diagrams. It’s good to develop consistent guidelines and also to align your problems on worksheets and assessments to avoid ambiguous problems. I set 100 ℃ to be 4 bars of thermal energy, room temperature (about 20-25 ℃) to be 2 bars. Three bars is something near the middle of those two temperatures and is a bit flexible depending on the beginning and end temperatures. One bar is used for 0 ℃.
For phase energy solid should be 1 bar, liquids 2 bars and gases 4 bars. The larger jump from liquid to gas is because the heating curve showed a greater input of energy for the particles to separate from liquid to gas. It also reflects our knowledge of the very large separation for particles in a gas that we saw from the density experiments in unit 1.
The energy bar charts are very good for leading into endothermic and exothermic processes later. Many students struggle with endothermic and exothermic for the simple reason that teachers often do not define what the system is clearly. For example, a chemical reaction in solution where the temperature goes up is defined as exothermic while melting an ice cube is endothermic. To a student, both of these are “hot” things and so this can be confusing. But in the first example the water is the surroundings while the chemicals reacting are the system, in the ice melting the ice is the system. Using LOL charts allows a clear point that every endothermic process is exothermic for the surroundings and every exothermic process is endothermic for the surroundings.
Activity #4 - Worksheets 1 and 2
Complete worksheets 1 and 2. On worksheet #2 one of the examples talks about water evaporating. This is a case where you do not have sufficient evidence to differentiate evaporation from boiling. So some students may put the final thermal energy at room temperature since the steam produced is surrounded by room temperature particles. Others may put it at a high temperature since the small amount of steam that evaporates might be at a high temperature since it turned into a gas. Thermal equilibrium and pressure both have implications here so it really might be better to avoid this example or conclude that at this point we don’t know. Personally I find the point of LOL diagrams to be framing the system and surroundings changes from initial to final states and thus the gain of this discussion is not worth the risk.
Activity #5 - Calorimetry Experiment
Activity 5 requires samples of metals. I use these sets from Flinn Scientific. The instructions given to students are to put one of the metals into boiling water. While the metal is heating up to 100 ℃, students should put 100 g of water into a styrofoam cup. The initial temperature of the boiling water (which should equal the initial temperature of the metal), the initial temperature of the water in the coffee cup should be recorded. Then the metal should carefully be removed from the water using tongs and placed into the coffee cup. The highest temperature of the water should be recorded. Students should have three total temperature measurements. Students then repeat this process for the rest of the metal samples.
I did not use equal masses of metal and water, but I will be altering that next year to reduce this as a distractor during a complicated discussion that ensues. The students will find that the water changes very little in temperature and the metal changes by quite a bit. For the whiteboarding, they should construct LOL diagrams for the metal and water and I had them place their temperature changes (ΔT) near the LOL diagrams.

Figure 3: LOL diagrams from hot aluminum being placed into room temperature water
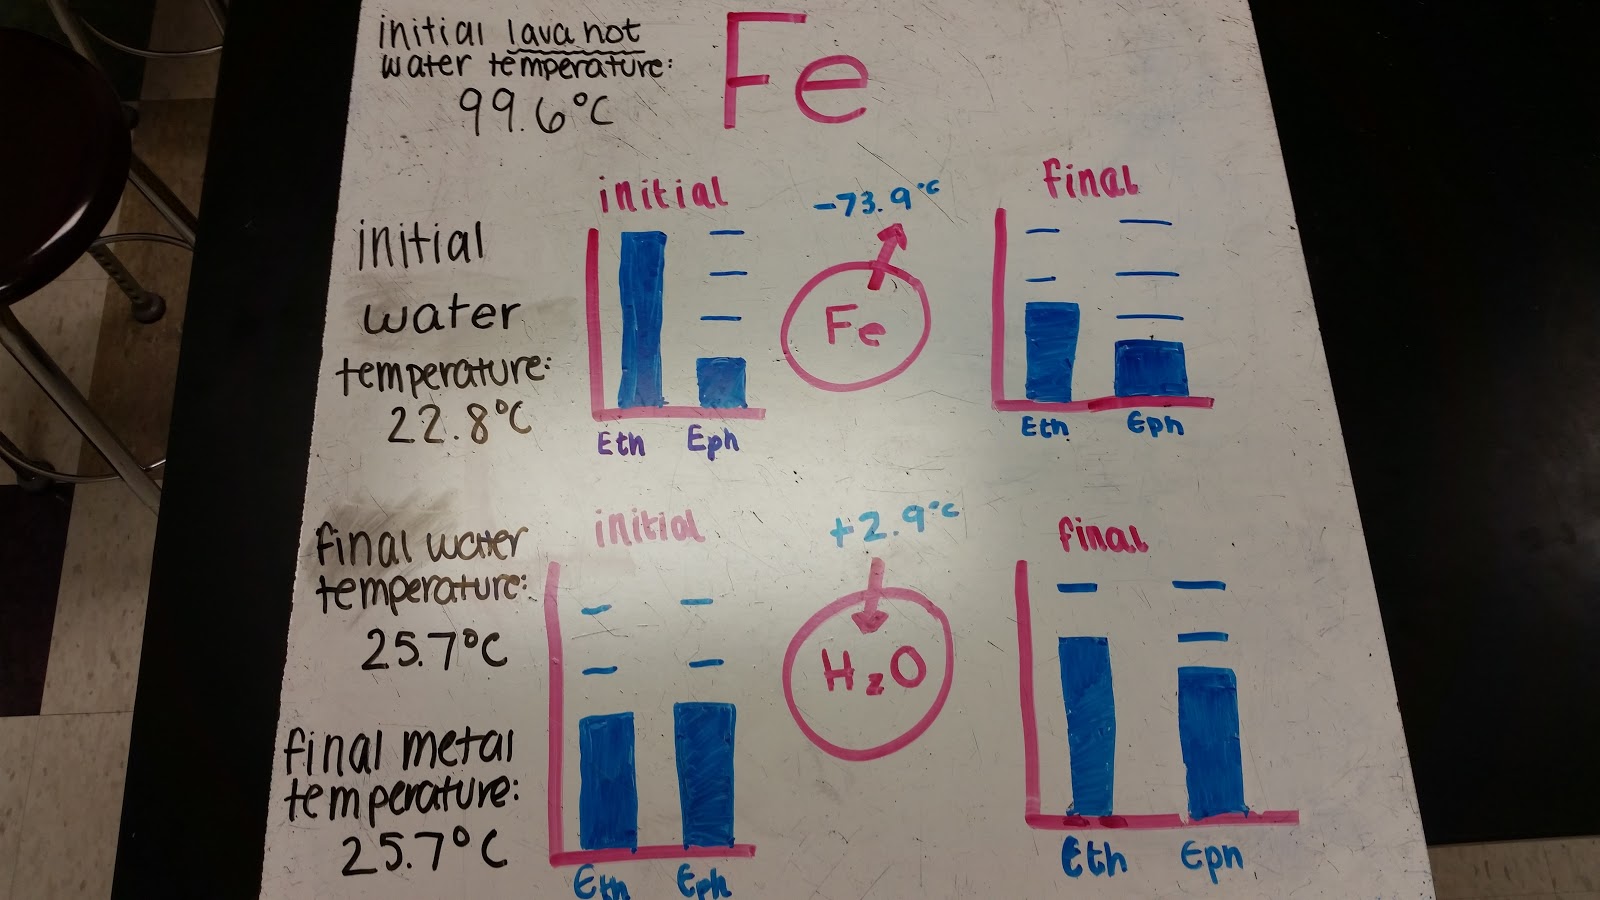
Figure 4: LOL diagrams of hot iron being placed into room temperature water
The board construction was met with many questions from students about whether they should even change the thermal energy of the water since the temperature change is so minimal. Others bring up the fact that how can the metal change by more energy than the water. During board construction I told students to choose what they felt was the best solution to these problems and we would work some of them out during the discussion.
The discussion for the whiteboards started with comparing the LOL diagrams and coming to a consensus on what the LOL diagrams should look like for the water and the metals. Differences between the metals can be mentioned at this point, but don’t have to be. After some thinking through what happened, the question needs to be refined down to how can the metal change by more temperature than the water. This needs to be clarified by the students that the energy exchanged is the same (you will need to highlight that the LOL bars are not quantitative to be able to do this), the temperatures change via collisions of the particles and somehow the motion changes differently. For the teacher, it may be helpful to note that the reason why translational speed and kinetic energy do not change by the same amount is that the molecules can vibrate and rotate and do other things besides moving in a linear fashion. So when a metal particle collides with a water particle, the water particle can move faster, or it can vibrate more, or it can rotate more.
Before defining specific heat capacity physically, I prefer to now go back into heating curves and compare what a heating curve would look like for a metal vs. water. The slope of the heating curve during temperature changes is critical. It also is a good time to invert the axes from temperature as the y-axis and heat as the x-axis to temperature as the x-axis and heat as the y-axis. A plot of Q vs. T allows the slope of the line to be named heat capacity. Thus for the y=mx function, y is heat (Q) and x is temperature (T). The slope being heat capacity gives us the function Q = (heat capacity)*(ΔT). Furthermore the heat capacity is affected by mass and we can define specific heat capacity as C = (heat capacity)/mass. Thus we derive the function Q = mCΔT using slope, our experimental evidence and heating curves. The specific heat capacity is the amount of energy needed to raise 1 g of a substance by 1 degree Celsius, it is a comparison of heat applied with mass and temperature change and it reflects the amount of energy needed for a specific amount of temperature change. It is influenced by the substances rotations and vibrations during collisions.
That is a lot of challenging material with a lot physics behind it. It is good at this point to present some simple analysis questions. Which has the higher specific heat capacity, water or the metals? What has the higher heat capacity, 100 g of water or 500 g of water? How will this implicate weather? Give functions with slopes of two different substances for Q vs. T and T vs. Q and ask which has the higher heat capacity. Show two blocks of the same mass come into contact where block A increases in temperature a little and block B decreases in temperature a lot and ask which has the higher specific heat capacity. You can also transition into algebraic problems at this time.
Activity #6 Worksheet #3
Before starting this worksheet, you must introduce the constants for enthalpy of fusion and enthalpy of vaporization. This can be done by constrasting the heating curve with the equation for Q = mCΔT. If there is no change in temperature during a phase change, then the energy needed to cause the phase change must be proportional to both the mass and some constant for the material. Thus Q = mΔHv for boiling/condensing and Q = mΔHf for melting/freezing.
It is also recommended to avoid evaporation at this point. Evaporation is not clear whether it should be calculated by raising the temperature of the liquid to the boiling point first or just using the enthalpy of vaporization. There is not enough knowledge at this point to confront this dilemna. I also have found that limiting conversions is very helpful to allowing students to focus on the content rather than be distracted by conversions.
When presenting whiteboards of worksheet #3, it is good to utilize the LOL diagrams and the heating curves so that students are better prepared to expand to multi-step calculations in worksheet #4.
Activity #7 - Demonstration of hot aluminum
Put a large beaker of water on a hot plate so that it boils. Take a small piece of aluminum foil and place it into the boiling water. Remove the aluminum foil with tongs, shake off all of the excess water and show students that the aluminum foil can safely be held with your bare hands. Note that it is critical you get the water off of the foil as the water can cause burns. This demonstration shows that aluminum at 100 ℃ does not have as much thermal energy as water at 100 ℃. The aluminum is warm, but not scalding like the boiling water would be. In fact, if the teacher can successfully delay by shaking off water for a bit, the evaporating hot water from the aluminum can cause enough cooling for the aluminum to be surprisingly mild. The specific heat capacity of water is 4.18 Jg-1℃-1 while the specific heat capacity of aluminum is 0.900 Jg-1℃-1. It is worth noting that metals can be dangerously hot, but only at much higher temperatures. Water rarely gets above 100 ℃ but metals can be heated to much higher temperatures such as in a flame.
Activity #7 - Superheated steam
This can be purchased from Flinn Scientific here. This is a video of the demonstration, the flash cotton is not needed, but is a fun addition if you have purchased some.
The superheated steam demonstration is important so that students learn that steam is invisible and that liquid water droplets are the cloud that people see that many think is steam. It is important to use the phrase liquid water and not something like condensed water vapor which sounds like it is still in the gas phase to many. This is a good demonstration because it shows steam being heated and most examples of water being heated conclude before this can occur. This allows a discussion on the final section of the heating curve of water and this discussion should be used to now understand how to calculate problems that involve multiple steps of the heating curve.
Activity #8 - Worksheet #4
Students should now complete worksheet #4. These problems are challenging and so having students complete a single problem in their groups to present helped the students focus on a more manageable task. They should be instructed to use a heating curve to identify the number of calculations needed and which equations to use should be connected to the five regions of the heating curve. This can also be organized using an LOL diagram if the phase energy bars and thermal energy bars that are leaving or entering the system are kept separate from one another. Depending on the struggles of the students a sample problem might be appropriate before starting the worksheet.
Activity #9 - Pipe Demonstration
Take a pipe and wrap a sheet of paper around it. Using a heat glove, place the other end of the pipe and paper into a flame of a bunsen burner. The paper may char a bit, but if the paper is tightly wrapped around the pipe it will not ignite. This demonstration has two possible explanations from students typically. Some state that the paper does not have enough oxygen particles hitting it for it to ignite. But the surface area is only halved and the paper very easily ignites when placed into the flame. The other explanation is that as the particles in the flame hit the paper, the collisions cause the paper to speed up briefly but then hit the particles in the pipe dispersing the motion. This prevents whatever happens normally that causes the paper particles to ignite when faced with very violent collisions. This is a good demonstration that can be done quickly and emphasizes heat as collisions between two sets of particles instead of a substance.
Activity #10 - Quiz unit 3
Activity #11 - demonstration hot and cold blocks
Instead of the blocks that look alike, I use cork and some folded up copper sheet metal. Have a couple of students determine which one is warmer and cooler. They will state that the metal is cooler and the cork is warmer. Then place an ice cube on both and the cork that is warmer will not melt the ice cube much while the copper melts the ice cube much faster. At this point the copper is even colder than before and you can have a student confirm this. I was surprised at how poorly the students could deduce an organized explanation of this phenomenon at this point in the unit. The key is identifying the temperatures of all three substances and the direction of energy transfer. The students have a temperature in the low 30s, the cork and copper are at room temperature in the lower 20s and the ice cubes are around 0 ℃. So the copper feels cool to people because it transmits energy quickly and the energy is flowing from the student to the metal. It also transmits energy quickly to the ice cube causing it to melt. The cork is an insulator and thus transfers energy slowly. This makes it feel warmer because energy is not leaving the student fast enough to feel cool. It does not melt the ice because the energy goes to the ice very slowly.
A danger with this demonstration is that it can be confusing to differentiate between the rate of energy transfer (conductor/insulator) and the amount of energy transfer (specific heat capacity). I do think you will see this happen whether you do this demonstration or not, but it’s good to be aware of when leading a discussion.
Activity #12 - Calorimetry
Going back to the video of the experiment done earlier, we conclude by showing students how to determine the specific heat capacity of a metal using calorimetry calculations. The premise is that the energy lost by one substance is the same in amount as the energy gained by the other substance (-Qmetal = Qwater). The use of negative sign is directional, and is a good preview of endothermic and exothermic to be used in a later unit. The temperature change is negative for one substance and positive for the other.
Activity #13 - review
For review I do “The Model Thus Far” posters. Students are provided a list of assessment objectives that I use for standards based grading and they use them to construct a poster that summarizes the objectives as well as connects concepts.

Figure 5: The Model Thus Far poster for unit 3
Activity #14 Unit 3 Test
Reflection on the unit:
- Many of the demonstrations are not needed for the unit, but a constant emphasis on the conceptual understanding of what specific heat capacity is from a perspective of slope, units, definition and experimental evidence is helped by many of the demonstrations.
- Try to avoid using energy at times, and instead guide explanations to focus on collisions, motion and force.
- Students struggled with heating curves and so in the future I would adapt this to include more on heating curves for substances besides water. It may have also helped to discuss why constants derived from the heating curve vary by discussing particle attractions more.
- I recommend avoiding the heating, working and radiating terminology used in the original unit. If you wish to throw back to what students had learned in prior classes, it is much better to define heat by saying that it involves a change in motion of a set of particles. For conduction this occurs via collisions of particles, for convection this involves faster moving particles moving to a new location and in radiation this involves light causing particles to move faster (technically this is how conduction works as well, just with greater distance involved).
- Many students are confused by the temperature change notation of ΔT. Adding in calorimetry calculations presents a good opportunity to remedy this by discussing ΔT as Tfinal - Tinitial.
- A google document of this can be found here where you can make a copy and edit for your own sequencing