Showing posts with label IB chemistry HL. Show all posts

Thursday, July 5, 2018

Effect of modeling pedagogy on IB Chemistry HL scores

Three years ago was a very busy time in my teaching career.  I had just attended a three week long workshop on teaching chemistry using modeling pedagogy.  I walked away ready to completely overhaul my teaching methods and even institute standards based grading in my chemistry class.  At the same time I was teaching IB chemistry HL for the first time ever. I had a group of seniors in their second year and a group of juniors starting the course.  Today we received our third set of data and the 2018 group is our first group of students to have been taught using modeling pedagogy prior to taking IB Chemistry HL. The first two groups (2016, 2017) took chemistry prior to IB Chemistry HL, but they took chemistry before I had attended the workshop and were taught using traditional teaching methods.  
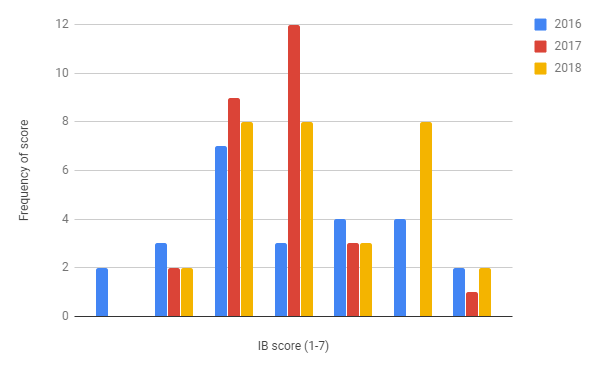
Figure 1: IB score distributions from 2016-2018
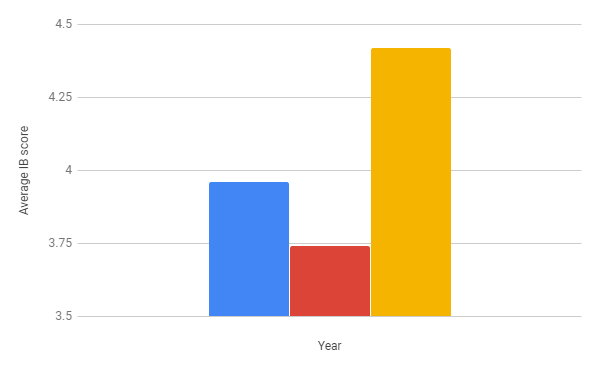
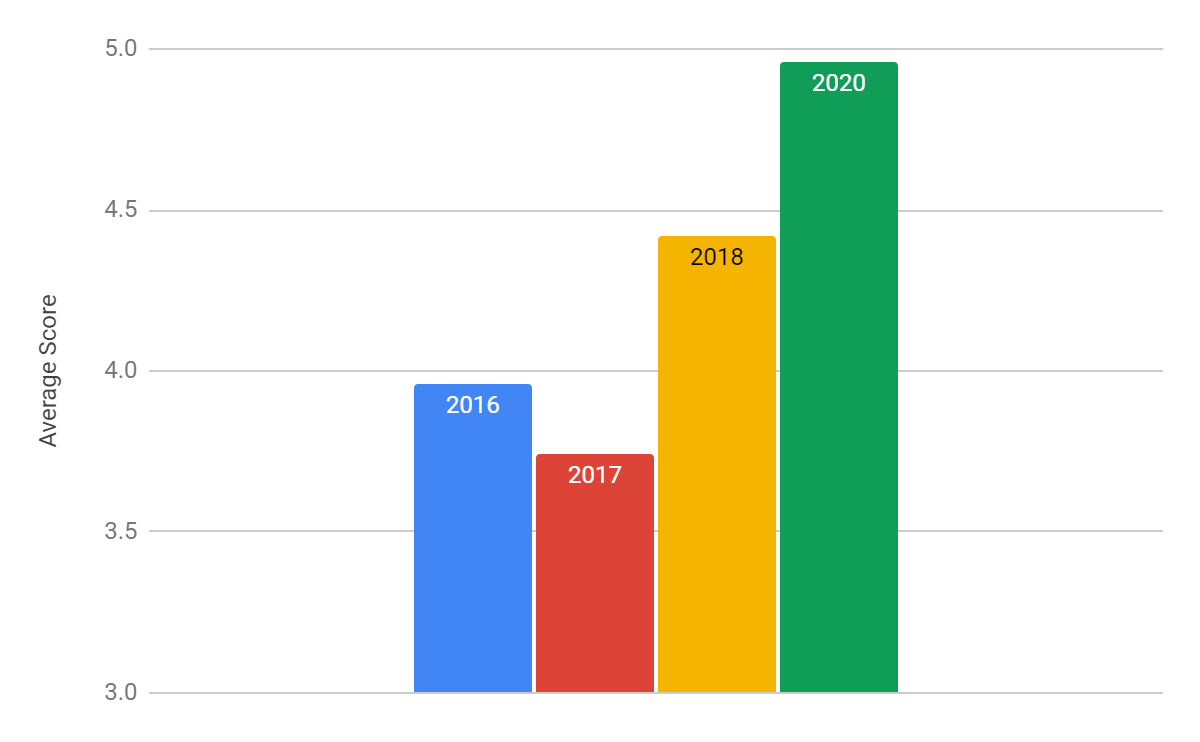
Figure 2:  IB average scores (3.96, 3.74 and 4.42) from 2016-2018


The data is limited because it only represents 25, 27 and 31 students for the three groups.  There is also likely variation in my teaching abilities as I have become more familiar with teaching IB Chemistry HL.  But the data does match my experiences while teaching the three groups. The modeling pedagogy increased the ability of the students to question the material we learned.  As the content became more difficult there was a presence of mind to push for evidence behind the conclusions I would present. While we did continue to use modeling teaching for some lessons (equilibrium, crystal field splitting) the biggest difference to me was the level of analysis that students applied in their learning was at a deeper level.  They made more connections between content areas, they were able to visualize systems at the particle level and change back to symbols quicker, they had more experience and context to learn in a more permanent fashion.  

None of these comments are an indictment on the first two groups.  All three cohorts of students had remarkably intelligent and successful students that did brilliant work in class.  They all had strong metacognition and did deep levels of analysis of chemistry. I also do not feel that I taught these first two groups poorly.  We did a lot of engaging activities and reflection for all three groups. The modeling approach in the chemistry prerequisite course I believe to have elevated the 3rd cohort to an improvement of that learning.  There is a frequent concern amongst teachers that altering teaching methods will lead to students not being prepared for the most challenging coursework that they will take in the future. While there is a lot of uncertainty and unreliability in the data in Figure 1 and Figure 2 based on student and teacher variation, there is evidence to support modeling having a positive impact on top students that move on to take a course such as IB Chemistry HL.  To get the IB Diploma students need to average a 4 score on their classes with a few technicalities mixed in. The % of students achieving a 4 or better improved from 52% to 59% to 68% over the three years. Many students that get a 3 in HL chemistry still get their diploma and students getting a 3 or better went from 80% to 93% to 93%. Our diploma rates for the three years were steady at 79%, 79% and 82%. It will be another two years before I have a group test as our program has grown and I now only teach every other cohort.

Update with 2020 scores:

Sunday, January 21, 2018

Do people with lighter skin have different sunscreen needs?


We spent a class period researching in groups and a class period discussing our findings.  The prompt was to construct an argument that skin color matters for sunscreen use and an argument that skin color does not matter.  From there our groups diverged greatly as they built up arguments and pertinent explanations.  
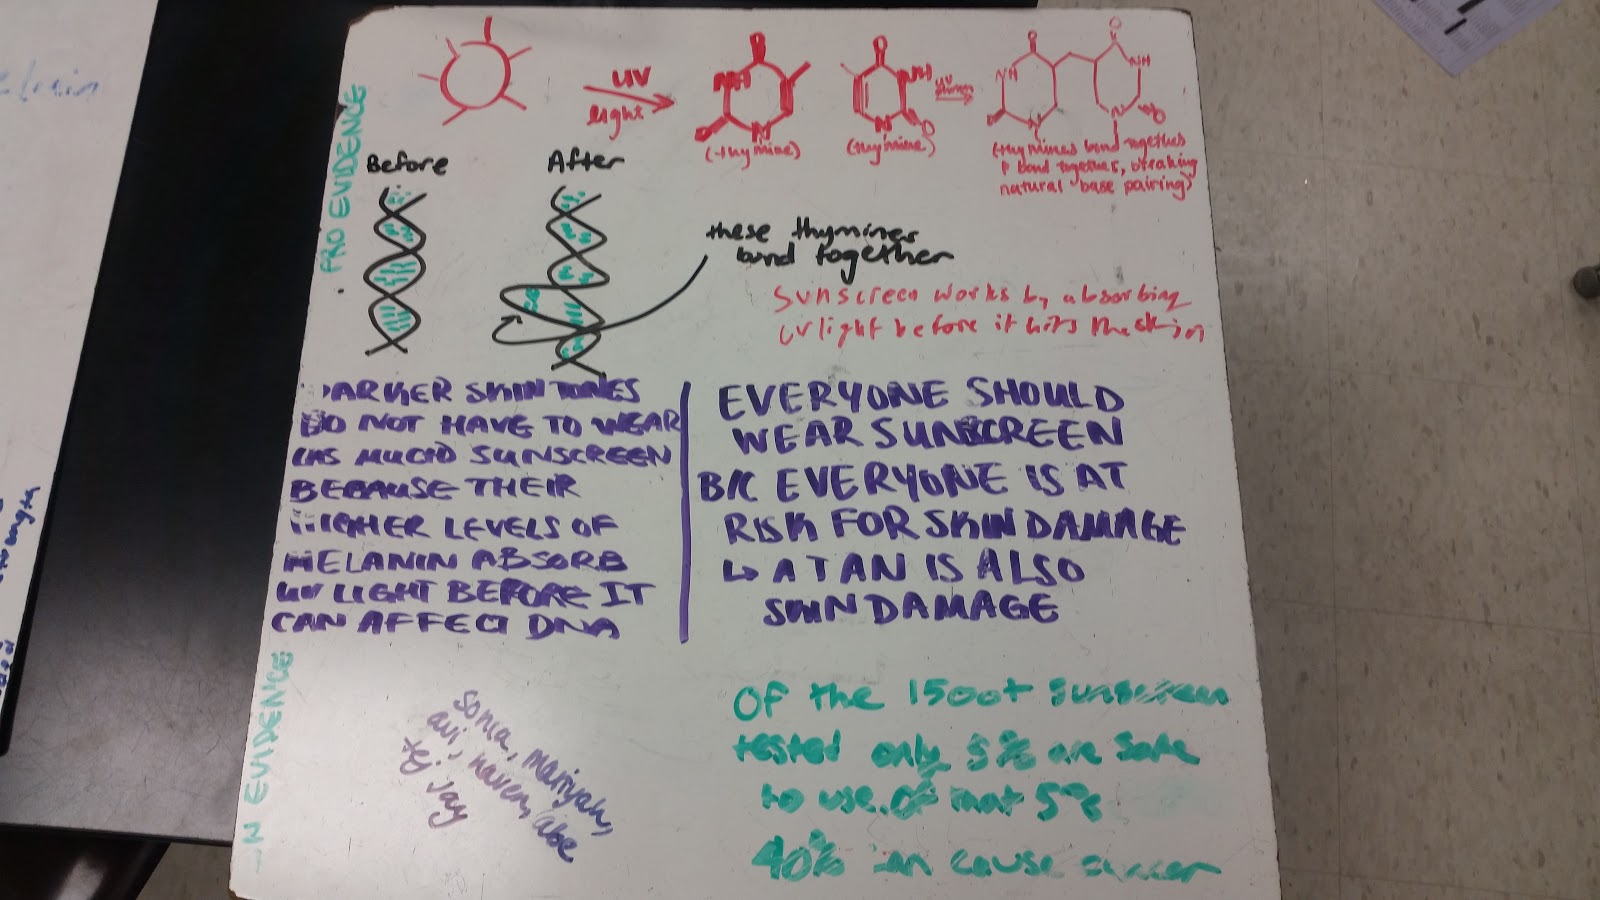
Figure 1:  Whiteboard 1 explores the mechanism by which UV light causes DNA mutations


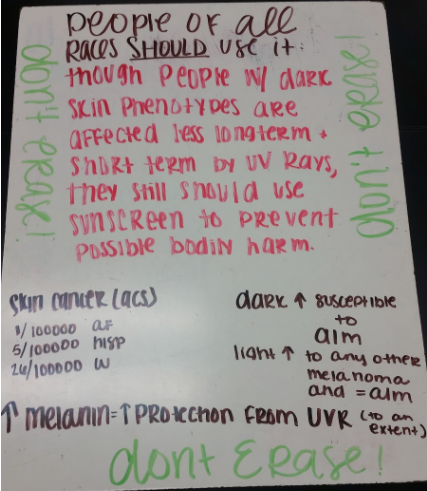
The wide variety of information in the various whiteboards led to some great discussion on content as well as generic science.  We discussed if knowing the mechanism of DNA damage by UV light is relevant so long as we see the data in Whiteboard 2 (below).  Students split but offered mostly arguments that mechanism knowledge is highly relevant to evaluate the conclusions from the data of skin cancer rates.  Multiple examples were offered such as some races might be located where they experience different exposure to sunlight, different races might also use different amounts of sunscreen on average and reporting of race can be inconsistent.  In general most students felt that just knowing skin cancer rates is insufficient and could be correlation without causation.  
We also talked about the mechanism by which UV light originates and under what conditions an electron can accelerate so much that it produces such high frequency light.  We connected the emission and absorption of light with the Balmer series for hydrogen.  We reviewed the spacing of energy levels and I instructed about the differences in energy level spacings for gaseous atoms/ions compared to molecular excitations.  We connected this later with Whiteboard 6 by talking about how a slight adjustment to a molecule can cause a minor change in the frequencies of light absorbed and how pigments and dye research often utilizes electron rich and electron deficient functional groups to shift color.   
Figure 2:  Whiteboard 2 found cancer rates based on race

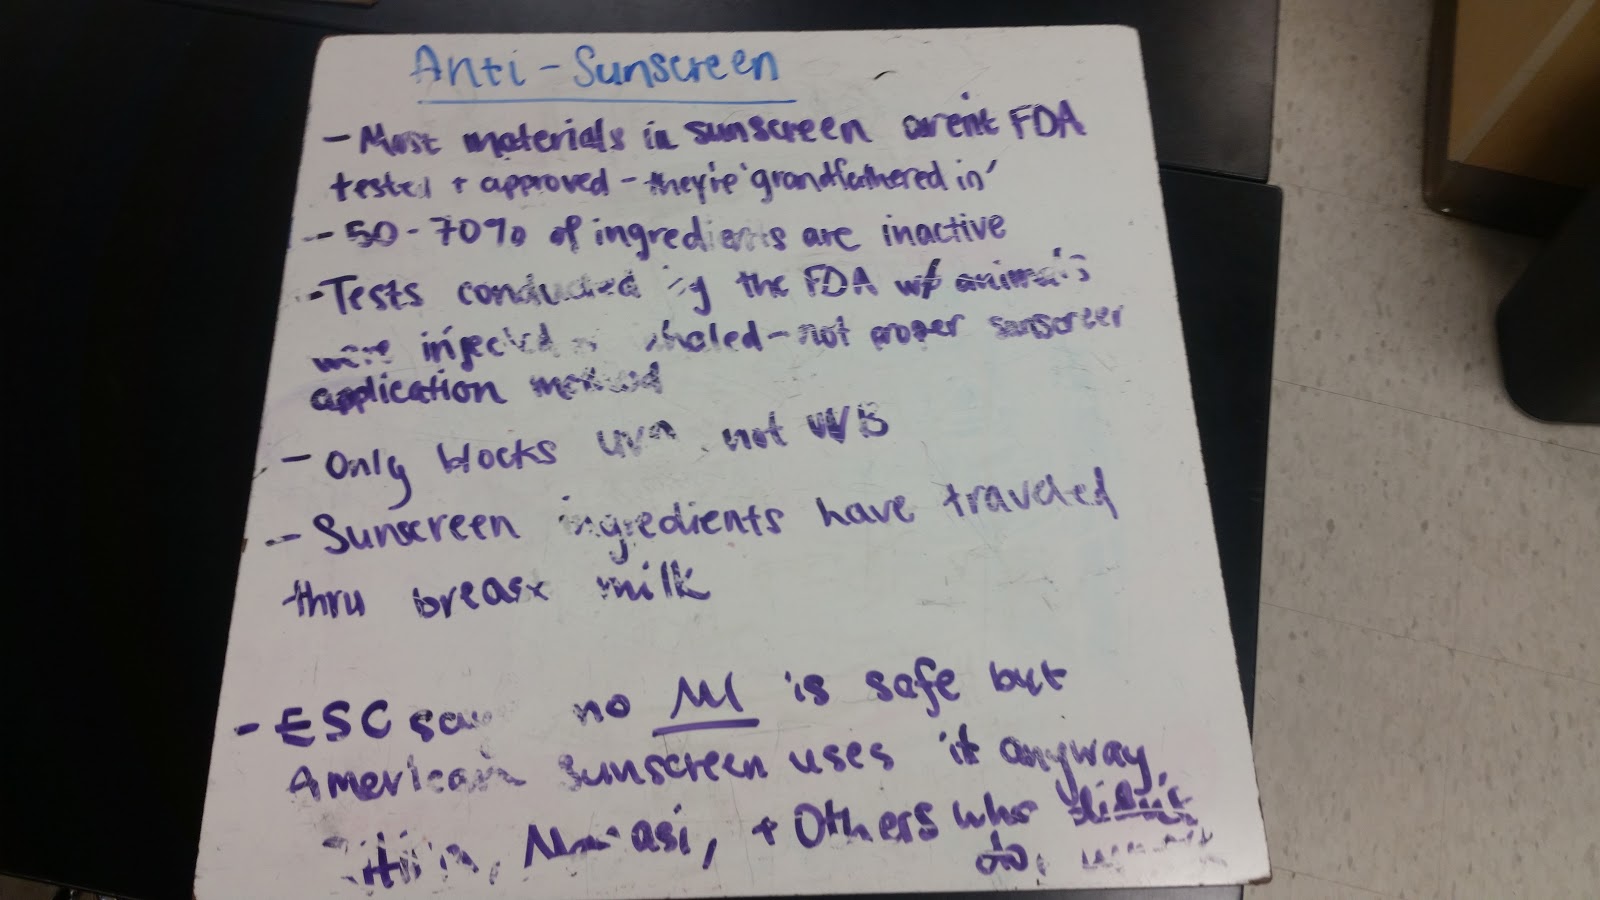
Figure 3:  Whiteboard 3 went full “Natural News” to locate some arguments against
sunscreen


This board led to a good discussion on sources of scientific information, how sources manipulate data and experiment into “clickbait” articles.  We posed the question “Are any of these things actually bad or do they just sound bad?”  For example, if sunscreen ingredients are present in breastmilk, is that bad or is it so infrequent and low in concentration that it is irrelevant?  We talked about how the FDA does not have jurisdiction over supplements and how labels for supplements are sometimes shown to be incorrect.  We also compared this board to the risks of not wearing sunscreen using Whiteboard 2 (above).  
Figure 4:  Whiteboard 4 summarized different wavelengths of UV light and nanoparticles
used for sunscreens

Figure 5:  Whiteboard 5 looks at melanin and interactions of sunscreens with UV light

Figure 6:  Whiteboard 6 looks at different chemical structures utilized in sunscreens


Conclusions that students made included that the SPF data they saw suggested that anything over SPF 50 was a marketing scam and was less healthy than using SPF 50 or lower.  We concluded that the mechanisms by which electrons change motion during electronic transitions in molecules are incredibly difficult to visualize and that this uncertainty can be problematic for understanding.  We concluded that everyone exposed to sun should wear sunscreen because melanin mostly protects from sunburn but not from DNA damage.  We saw a variety of organic molecules used to absorb UV light as well as alternatives such as ZnO nanoparticles.  We started our discussion by looking at how 11 cis-retinal converts into 11 trans-retinal when absorbing visible light and this is the mechanism by which our brain becomes aware of light hitting our retinas.  We talked about the breaking of the pi bond before the rotation occurs and later compared this to potential changes in molecular structure when UV light is absorbed by molecules in sunscreen.  
As a teaching lesson I was highly pleased with the variety of topics to discuss and the variety of information students used to make arguments.  Students looked at chemical structures, DNA damage mechanisms, skin cancer data, sunburn data and how UV light itself varies.  We identified what type of light escapes the sun as a subject that requires more research.  We will continue to use this topic throughout our review.  We saw connections to organic chemistry, quantum chemistry, periodic trends and bonding.  It was interesting to the majority of students.  Some students asked what it was like to be sunburned because they had never experienced it before and most students had limited ideas coming into the discussion but left with much better knowledge.  

Tuesday, September 27, 2016

Inquiry Quantitative Analysis Experiment

Quantitative Analysis Experiment
A copper (II) sulfate of unknown concentration is prepared for each lab group.  The solutions are then distributed where each group gets slightly more than 50 mL of solution to analyze and determine the concentration of in two manners.
20160923_091928.jpg
Figure 1:  0.50 M solution of CuSO4 (middle) with two solutions with unknown concentration


Day 1:
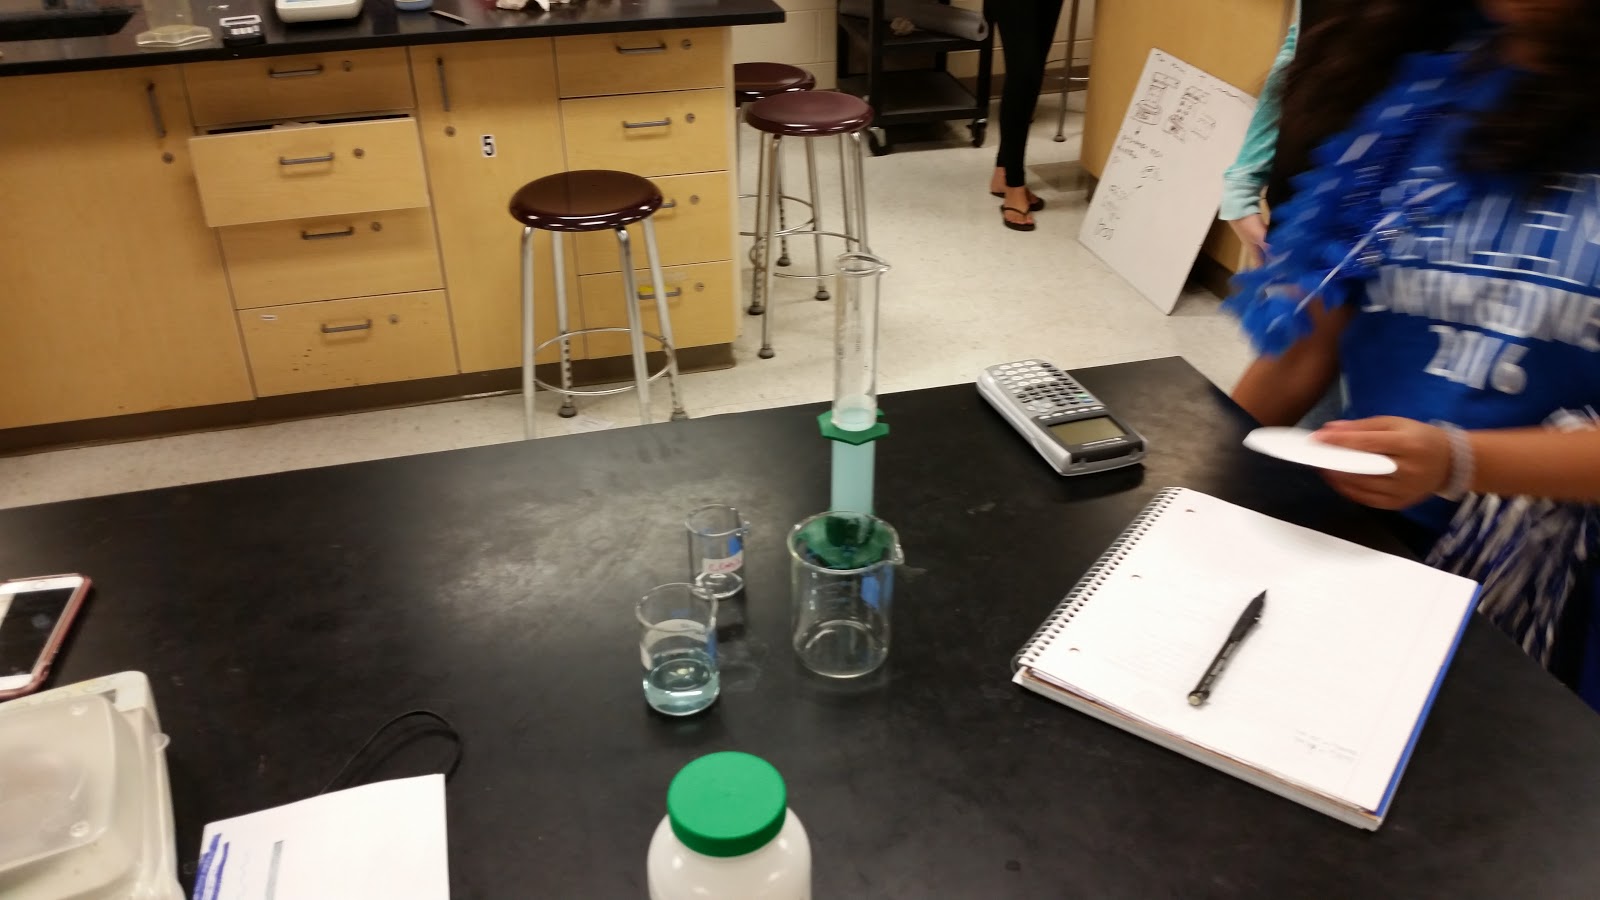
After students receive their samples they should separate a large portion of their solution to mix with 0.2 M barium nitrate solution.  This forms the barium sulfate precipitate that can be separated via filtration as shown below.  
20160923_092011.jpg
Figure 2:  The graduated cylinder contains the unknown solution after mixing with barium nitrate


filter 2.png
Figure 3:  The mixture is now ready to filter, wash and dry


Day 2:  
Today the students prepare a set of solutions with varying concentration to construct a calibration curve.  The students have 0.50 M CuSO4 solution and distilled water.  It is up to them to determine what an acceptable range of concentration is given the parameters that the highest and lowest possible concentrations are 0.08 M to 0.001 M for the unknown solutions.  Today the students are also instructed on how to use the Vernier spectrophotometers to produce a line of best fit from their calibration curve.  They are taught how to calibrate the spectrophotometer with distilled water, how to handle the cuvettes, how to select the appropriate wavelength of light for analysis, how to construct the calibration curve and finally how to produce a line of best fit for their data.  Students may obtain the mass of their precipitate from day 1 at this point.  Any errors in washing should be fixed today.  


display.png
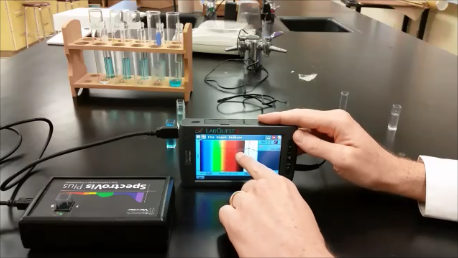
Figure 4:  The spectrophotometer can be used to determine the appropriate wavelength for analysis, in this experiment red light near 700 nm is a good choice


Day 3
Students continue making solutions, testing the solutions with the spectrophotometers and begin calculations for their experiments.  Students may re-mass their precipitates from day 1 again to confirm no water was present on day 2.  Calculations should show how the concentration in molarity was determined in both experiments and should comment on the answers produced by both methods and what errors occur in each that make one method superior to the other.  

Video of the experiment

Thursday, August 20, 2015

Foreign Currency Under a Black Light

It can be tempting to try to compartmentalize the teaching of light to simplify down the abstract components into simpler and more approachable constructs.  But the art of light should always shine when teaching about the topic.  While we are limited to seeing only visible light, we can see evidence of the other kinds.  Microwaves can be used to expand a bar of Ivory soap or melt a chocolate candy bar in systematic fashion.  Older cell phone cameras can detect infrared light from remote controls and ultraviolet light causes many chemicals to fluoresce and produce visible light.  The brown spots of a banana, the chlorophyll pigment extracted from spinach leaves, quinine (tonic water), used or new glow sticks, laundry detergents and many more things will fluoresce visibly under ultraviolet light.  
One of the best demonstrations of ultraviolet light is paper currency.  While the exact chemicals used are not disclosed to prevent counterfeiting, one can find one of the general blueprints1 if you find the right source.  Last year I had students and teachers bring in as many different foreign paper currencies as we could find.  I then recorded the front and back of each currency under a black light.  The intricate patterns and imagery used varies between countries.  The best ones that made the final video were India, Singapore, China, Sweden, Australia, Japan, Cambodia, Myanmar, the Euro, Budapest, Venezuela, Saudi Arabia, Canada, Kenya and the United States of America.  The video can be found here.  Two of my favorites were Sweden and Saudi Arabia.  Sweden has something written that I have not been able to find someone to interpret yet.  Saudi Arabia has a picture of former King Fahd2 not only on the bill itself, but also an image of him is done in the fluorescent dye that emerges under the glow of the ultraviolet light.  
While there are many obscure (scorpions and vaseline glass3) and accessible (driver's license) items that fluoresce under ultraviolet radiation, having students bring in foreign currency is a fun way to engage students in the demonstration.  Much of the money brought in was lower in value and so there were no huge concerns from students or parents about mixing up money and those that did came prepared with labeled envelopes.  There usually is variation depending on value although not always.  This demonstration can be used for a variety of topics, but it is important regardless of level that students “see” the other forms of light when possible.  All light has the same composition but varies in frequency, wavelength and energy.  In fluorescence the light incident on the material is higher in energy and frequency than the light emitted.  The electronic excitations are followed by the electrons shifting to a lower excited state before falling back to the ground state.  Thus we are seeing ultraviolet light incident on the paper money and blue or green or red light emitted back.  Perhaps you care to expand on currency to the magnetic ink used or the cost of making a penny.  Whether you aim to tie this into photoelectric effect, calculations relating frequency and wavelength, demonstrating the seven classifications of light or something completely different is up to you.  Feel free to share any cool findings.  


3. http://sciencenotes.org/list-of-things-that-glow-under-black-light/ accessed on 7-29-2015


Monday, August 17, 2015

Erroneous IB Syllabus a Great Opportunity To Shift Solubility Away From Acid-Base Education

Acid-base indicators incorporate many levels of acid-base theory.  Usually what an indicator is follows the analysis of a titration curve to assess the understanding of end point vs. equivalence point.  By this time, the student is expected to have some familiarity with pH, strong vs. weak, salt hydrolysis, buffers, acid-base equilibrium calculations as well as the stoichiometry calculations that accompany a titration.  
Indicators can be a fantastic opportunity to reinforce complex ideas from acids and bases because the selection of an appropriate indicator can accompany analyzing why the pH changes most rapidly near the equivalence point and this can provide clarity to the logarithmic scale of pH that is often masked by the even more troubling scales of concentration.  Beyond the titration curve, an indicator is a great chance to teach or reinforce the notion of weak acids and bases.  
An acid-base indicator is typically a weak acid that changes color when it changes form to the conjugate base (or vice-versa).  When a small amount of indicator is put into a solution, the indicator will give information about the solution via a very simple observation, the color it becomes.  A solution with higher concentrations of hydrogen ions will form mostly the protonated version of the indicator while a solution with higher concentrations of hydroxide ions will form mostly the deprotonated version.  There will always be some of both forms present.  When the pH of the solution matches the pKa of the indicator, there will be equal quantities of basic and acidic form of the indicator.  These explanations of indicators are very well summarized by the 2016 IB chemistry syllabus on page 94 (copied below).  
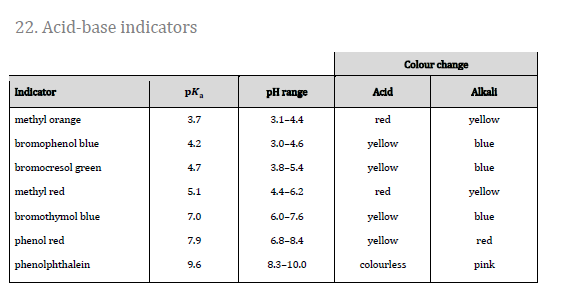
The indicator in the acidic form will occur in acidic solutions where pH is less than the pKa, the basic form of the indicator will be present more in solutions where pH is greater than the pKa.  When the pH is near the pKa we will see some of both colors present.  For example, bromothymol blue is an indicator that is yellow in the acidic form and blue in the basic.  When put in a solution with a pH near the pKa of bromothymol blue (7.1) then both forms of indicator are present and the solution will be green.  At a pH of 6.1 there will be 10x as much of the yellow form and at a pH of 8.1 there will be 10x as much of the blue form.  
There is a small problem, however, with the language used by the IB syllabus above.  The indicator is really not a weak acid in isolation, rather it is a chemical that can exist in an acidic or basic form.  It can be both a weak acid and a weak base and which it is largely depends on what solution it is put into.  The reaction could easily have been rewritten in reverse and nothing about the chemical would be altered.  This could stem from an early introduction to acids and bases where they are treated in isolation.  Many are taught that acids are chemicals with a pH less than 7 and bases have a pH greater than 7.  Instead it should be taught that an acid is something that transfers a hydrogen ion to something else and a base takes that hydrogen ion from something else (or electron pair interactions if we expand to include Lewis acids/bases).  This is a very critical difference that often is overlooked.  The key here is that an acid does not exist until a base is present.  Much like oxidation and reduction being reliant upon one another, so are acids and bases.  Hydrochloric acid is not an acid until it has something capable or taking away its proton.  Once you put hydrochloric acid into water, the hydrochloric acid reacts with that water to transfer a proton to it and the water acts as the base accepting that proton.  For an indicator, the indicator is acidic when it is transferring a proton to something else and a base when taking a proton away from something else.  To label an indicator as a weak acid is both incomplete and it also reinforces the weaker approach to acids and bases.  From here the syllabus gets worse.

Below the explanation of weak acid indicators, weak base indicators are introduced.  There are several issues with this.  First of all, there are no indicators that react in this manner.  Every indicator presented in the data booklet is of the type that changes color via a proton transfer (the indicators presented in section 22 of the data booklet can be found at the end of this post).  Some have a pKa less than 7 indicating that they change color in an acidic environment and some have a pKa greater than 7 indicating that they change color in a basic environment.  But as explained above, these are all chemicals that act as both weak acids and weak bases.  If the IB syllabus had stated that the indicators that are weak bases react as: In-(aq) + H+(aq) → HIn(aq) it would be misleading and in poor form educationally, but not as incorrect.  Instead they chose to show a very odd solubility reaction that in no way is an acid-base reaction.  Why would they choose this generic reaction?  
The purpose of this reaction is to accompany a poor way of defining acid strength, solubility.  A strong acid is nearly always defined as an acid that completely ionizes when dissolved in water.  Strong bases are treated the same.  This is a problem because it is often interpreted that the action that makes something a strong acid is that it dissociated in water.  What makes something a strong acid is that it has a weak bonding interaction with the hydrogen ion attached to it.  This allows most bases to easily remove that hydrogen ion.  In other words, a strong acid is very good at transferring a proton to something else.  The ability to transfer the hydrogen ion makes something a strong acid.  A strong base is something that has a strong affinity for hydrogen ions and can easily take them from something else.  When you put a strong acid into water, the strong acid is good at donating a proton to the water and so it does so very frequently with fast kinetics and very soon all of the hydrochloric acid has reacted with water to form chloride ions and hydronium ions.  
HCl(g) + H2O (l) → Cl-(aq) + H3O+ (aq)
Sometimes this is written as HCl(g) → H+(aq) + Cl-(aq) which is not nearly as accurate because the hydrochloric does not split apart.  A water molecule or other base is needed for this separation to occur.  
Some strong bases are not even used in water.  NaH is a strong base using commonly in organic chemistry and is delivered in an organic solvent.  The NaH is delivered using an organic solvent to the reaction mixture.  If water is present the NaH will react with the water to produce hydrogen gas and NaOH.  NaH is a strong base because the hydride has a very large amount of negative charge that can easily attract a proton to become hydrogen gas H2.  
Historically we have easily been able to detect the presence of these ions through conductivity tests that show that the strong acids like HCl produce ions in solution.  There are a lot of limitations that arise when we try to make this our definition of strength.  The act of dissolving is not actually what produces the ions.  When ammonia (NH3) dissolves in water it forms aqueous ammonia.  A very small amount of this aqueous ammonia reacts with water to form hydroxide ions.  The reason why ammonia is a weak base is because it is not as good at pulling an H+ away from a water molecule as water is at pulling it back.  Very few collisions result in the transfer of a proton from the water to the ammonia.  But ammonia is highly soluble in water (for a gas).  It is the reaction with water, the acid-base reaction that produces the ions.  
For strong bases, some of them dissolve in water to produce ions that directly impact the equilibrium affecting pH.  Sodium hydroxide dissolves in water to produce sodium ions and hydroxide ions.  
NaOH(s) → Na+(aq) + OH-(aq)
This is where a lot of problems arise.  This dissolving is directly producing ions that will affect the equilibrium in the solution.  These ions still react.  A hydroxide ion will react with a water molecule, but it produces a different hydroxide ion and a different water molecule.  If we dissolved NaOH into water with an oxygen isotope we would see reactions of OH-(aq) + H2O18(l) → H2O(l) + O18H-(aq) where a proton would transfer from the water to the dissolved hydroxide.  Another problem here is how to label bases such as Mg(OH)2 and Al(OH)3.  These bases have very limited solubility in water, but the dissolved components are ionized.  The large amount of charge on the metal cations causes the electron density on the oxygen atom in the hydroxide to shift further towards the cations and is less available to pull hydrogen ions away from water molecules.  Some call these bases insoluble bases, some call them strong bases and some call them weak bases.  
When we try and expand this definition of strong acids and bases to apply towards weak acids and bases things continue to falter.  A weak acid or weak base is defined as an acid or base that partially ionizes when dissolved in water.  I once heard a teacher explain that weak and strong are bad adjectives to use to describe acids and bases because it is always relative to what it will react with.  They recommended using weaker and stronger instead.  This makes a lot of sense on a particulate level.  A generic reaction for this would be:
HA + B → A- + BH+
If HA is a stronger acid than BH+ or B is a stronger base than A- the reaction will be product favored at equilibrium.  A- could be a very strong base and B could still be stronger and that would be all that matters.  
Defining strength for acids and bases by acid-base reactions relative to the conjugates formed allows a much better and deeper understanding of acids and bases.  It can be used to reinforce the notion that an acid and base are dependent upon one another to react.  It also can easily be summarized in the minds of a student since a strong acid is something good at being an acid.  A strong base is something good at being a base.  This can be tied into bonding and thermochemistry quite easily.  Using solubility to define acid-base strength is confusing.  It muddles solubility and acid-base reactions and produces students that do not fully understand acid-base chemistry.  The IB chemistry syllabus should never have had the definition of a weak base indicator.  It is rife with misconception and poor concept of acid-base chemistry and will mislead teachers and students in exchange for an algorithmic exchange of chemistry related statements (IE when I say weak acid, you say partially ionized).  Even reading through the email responses I see flaws in the analysis of my challenges to the syllabus.  The full text of emails are presented below with names removed.  

Text of email exchanges with IB support:

Stakeholder By Web Form (Scott Milam)
07/15/2015 02.51 AM
Hello, I am working on the acid-base 18.5 section in the 2016 syllabus and it says:
For an indicator which is a weak base:
– BOH(aq) --> B+(aq) + OH-(aq)
Colour A Colour B
This makes no sense to me, is this an error that is being revised or is there some example of some odd organic indicator that fits this criteria? This is not an acid-base reaction and I would teach a basic indicator as In-(aq) + H+(aq) --> HIn(aq) exactly the same as it indicates for a weak acid indicator since the conjugate is merely another weak acid or base. I would prefer not to teach what it says in the syllabus as it appears to me based on the application of the limited definition of completely ionized in water for strength.

Response Via Email (Administrator)
07/17/2015 07.33 PM
Dear Scott,

Thank you for your e-mail.

I believe that this example has been taken to draw attention to the fact that indicators can also be weak bases although, you are right, they are not really common. These reactions are not acid base reactions but relate to dissociation of weak acids and bases.
Teaching the following reaction, In-(aq) + H+(aq) --> HIn(aq), to explain indicators is perfectly fine.

Best regards,

Stakeholder Via Email
08/10/2015 06.10 PM
Is there one example of a weak base indicator you could provide that fits
the syllabus definition?

Discussion Thread
Response Via Email (Administrator)
08/14/2015 05.58 PM
Dear Scott,

I agree that the equation should have been a salt reacting with water forming hydroxide ions but the authors of the syllabus decided to simplify the reaction to stick to the rather general definition of a (weak) base.

Best regards,

I can’t format a double arrow, so I just used single arrows even when equilibrium for a reaction would make a double arrow more appropriate.  
I also ignored the dissolving of a cation as a Lewis acid-base reaction in parts of this analysis for simplicity, but complexation is a type of acid-base reaction as well.